Of Motor Vehicles and Men
Two Decades of Vehicle Complaints and the Changing Landscape of Auto Safety
TL;DR
I study a dataset from the National Highway Traffic Safety Administration (NHTSA) covering vehicle owners' complaints from 2001 to 2023.
Complaints have increased over time, from roughy 2,000 monthly in the early 2000’s, to roughly 4,000 per month in recent years. The low-frequency trends reflect increasing number of complaints about engines and lights, while the spikes in complaints reflect specific issues like airbags and breaks.
Common metrics we might expect to explain vehicle complaint rates — such as search trends involving “complaint”, vehicle sales, and vehicle deaths — bear only limited correlation to the number of vehicle complaints, but they do successfully capture some variation (e.g., the drop during Covid).
Ford consistently has the most complaints among all auto manufacturers, and there is a growing number of complaints about electric vehicles. After the pandemic, there has been an interesting divergence in the number of complaints across manufacturers (Ford vs. GM / Chrysler and Honda vs. Toyota).
Introduction
Welcome back to Better Know A Dataset. For the second post in this series, I study vehicle owner’s complaints about their vehicles. This dataset is provided by the National Highway Traffic Safety Administration (NHTSA), a U.S. government agency responsible for ensuring vehicle safety. The agency solicits complaints from consumers in order to identify potential safety concerns that may require further investigation; consumers, in turn, tend to file complaints when dealerships cannot easily fix their issues or when the resolution would take too much time.
Of the many datasets to study, why choose vehicle complaints? I was drawn to this dataset because the auto market is undergoing some major changes, e.g. the widespread integration of Internet of Things (IoT) devices. I was curious how these changes could affect what people say about their cars and what problems they face. Additionally, my partner and I are looking to buy a car for the first time, so knowing about common complaints and safety issues is no doubt helpful as we navigate the purchasing decision.
The complaint data is freely available from the NHTSA website, and it has good coverage of information you would like to see for a given complaint: in total, there are 49 variables in the dataset that includes information such as the consumer’s location, the model year, the date of the incident, and a description of the complaint:
For the purpose of this blog, I’m going to focus on the time period from 2001 to 2023, which comprises 1,185,132 historical complaints.1
Some basic facts about vehicle complaints
Let’s first start by looking at some basic facts about these complaints. I’m going to first look at how the number of complaints have changed over time.
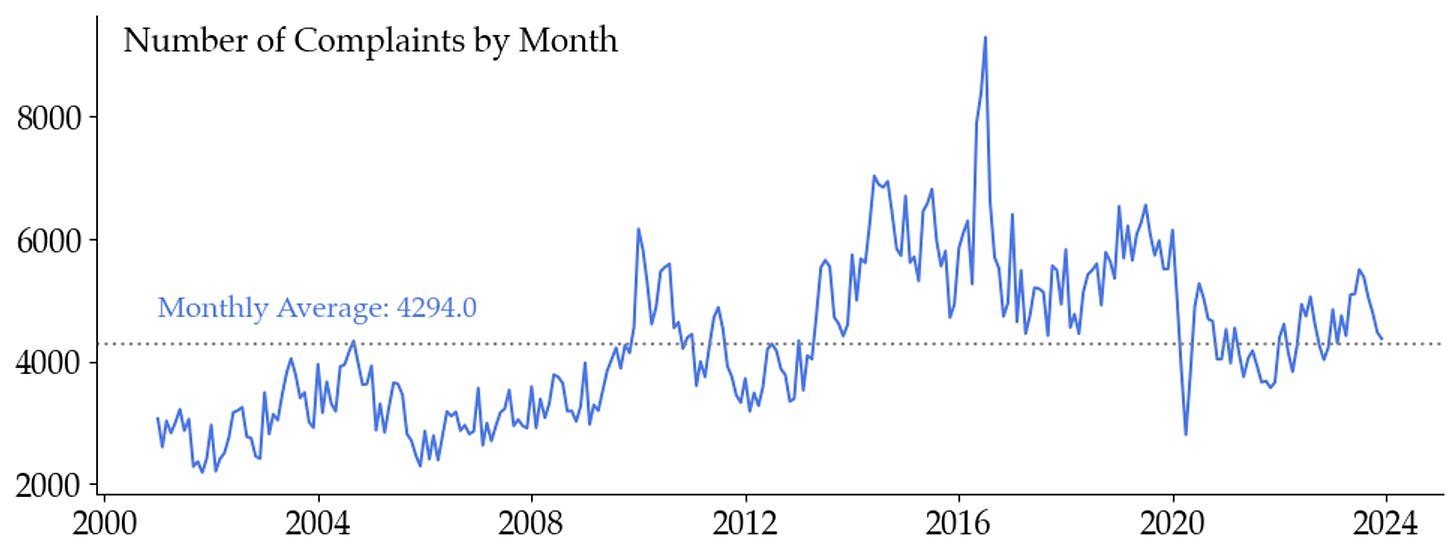
Figure 1a plots the number of complaints in each month. On average, there are about 4,300 complaints per month, but the number filed each month has varied over the years. There's a clear upward trend, reaching a peak around 2016, with over 8,000 complaints in some months. This could be due to increased awareness and ease of reporting issues through electronic means — more on this in the following sections. Since 2016, the number of complaints has generally declined but still fluctuates significantly. We also see a notable dip around 2020, which I’ll get to a bit later in the post.
Figure 1b illustrates the total number of complaints per month throughout the year. While there is a slight increase in complaints during the summer (perhaps due to more driving) and in January (cold weather? car inspections?), there is not a strong seasonal factor.
What drives the time-series variation?
To further think about what drives the time-series variation, it’s useful to consider a simple model of how a customer might decide to file a complaint, which we can represent using the following simple probabilistic model:
In simpler terms, this equation says that the likelihood of a vehicle complaint depends on four main factors: (i) owning a vehicle, (ii) driving the vehicle, (iii) encountering an issue during the drive, and (iv) deciding to file a complaint about that issue. Expressing the probability of a complaint in this way helps us form hypotheses about what drives the time-series variation in the number of complaints over time.
P(vehicle): This is about how likely it is that someone owns a car. Factors like how the economy is doing, personal needs, and how easy it is to buy a car all play a role. For example, if the economy is booming, more people might buy cars, so the chance of owning a vehicle goes up.
P(drive | vehicle): This represents the how much the vehicle is driven, which can be influenced by factors such as fuel prices, commuting patterns, and remote work trends. If more people are driving, the chances of encountering issues with their vehicles increase. The dip in 2020 in Figure 1 could be due to the incidence of COVID-19, for example.
P(issue | drive, vehicle): This is the chance that a car owner runs into a problem with her car while driving. Modern cars are pretty complicated, so issues can pop up, especially as cars get older or if there are manufacturing defects. This probability can also fluctuate over time with the introduction of new vehicles or changes in the production process.
P(complaint | issue, drive, vehicle): This is how likely it is that a car owner who has a problem will actually file a complaint. This depends on things like how aware people are of the complaint process, how easy it is to file a complaint, and whether they think their complaint will be taken seriously and resolved. If filing a complaint is simple and people believe it will help, they're more likely to report issues.
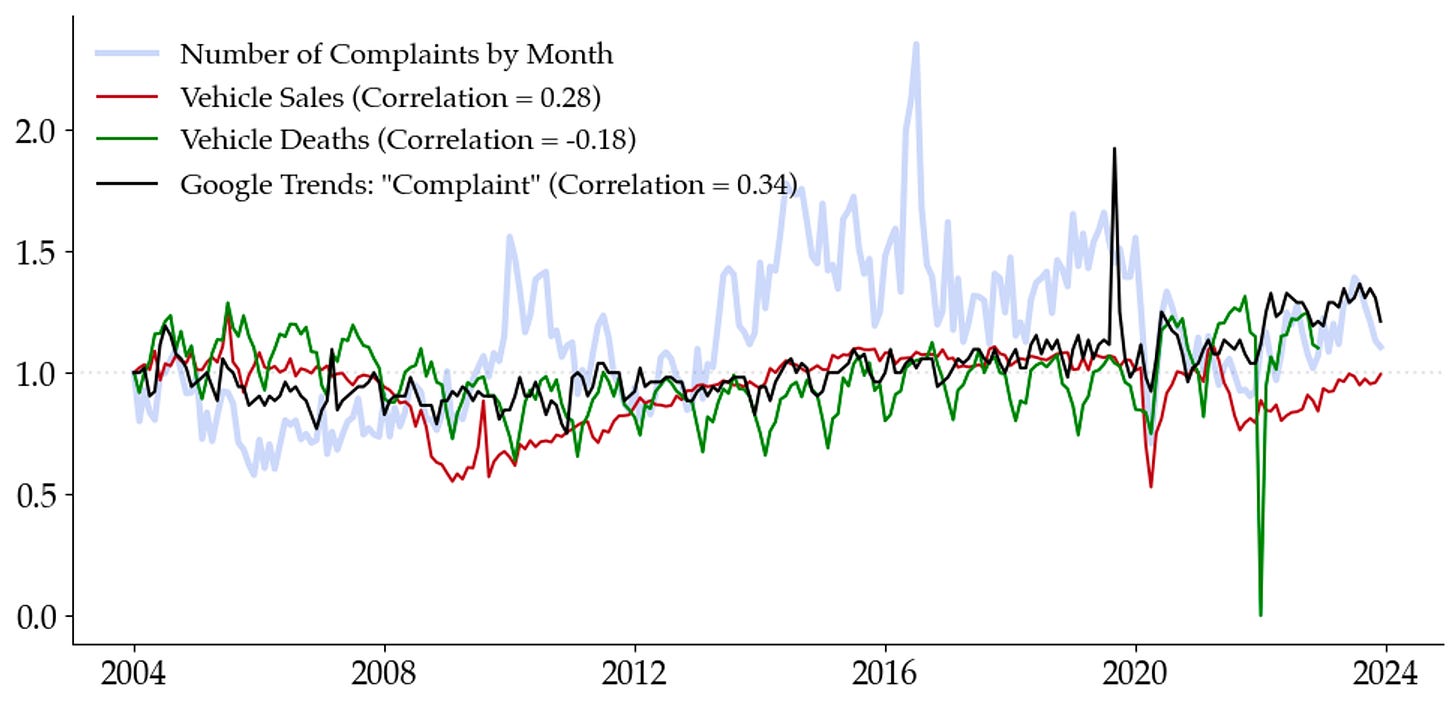
To get a sense of which component can explain the time-series pattern well, I plot the monthly complaints with other time-series variables normalized to the value of 1 starting in 2004, which is shown in Figure 2:
The line in red is the total vehicle sales per month, available from the Federal Reserve Bank of St. Louis database (FRED).2 This time-series has a weak positive correlation of 0.28 with the monthly frequency of complaints. Notably, vehicle sales dropped during the Global Financial Crisis (GFC) and slowly rebounded, but it doesn't seem to generate the peak around 2016 that we see in the complaints data. It does drop around COVID-19, as these sales have a positive beta on economic conditions.
The line in green is the number of motor vehicle deaths by month, obtained from the National Safety Council (NSC). This series shows a correlation of -0.18 with the monthly complaints, suggesting a slight inverse relationship. An interesting feature is its cyclicality, with a huge drop in the latter half of 2021, which is puzzling (but not critical for this blog).
Finally, the black line is the Google Trends series for the search term “complaint.” This series captures the relative frequency of searches for "complaint" over time, which I interpret as reflecting the overall “tendency to complain.” It has the highest correlation of 0.34 with the monthly complaints among the three series. Interestingly, the search term peaks before COVID and doesn't seem to suggest that the average person has become more likely to complain over time.
So it seems that the drop in COVID is well explained by subdued economic activity that led to reduced vehicle sales (red line) and fewer crashes on the road (green line). On the other hand, the rise in complaints in 2016 is still not well explained by these variables.
What do people complain about?
One interesting aspect of the dataset is the column that contains the text of each complaint. But before diving into the details of what people are saying, we can get a sense of the nature of the complaints by looking at the fraction that involve injuries or deaths. In Figure 3, I plot the fraction of complaints that involve at least one injury or one death:
The first panel of Figure 3 shows the fraction of complaints that report an injury. This fraction has generally declined over time, from about 8% in the early 2000s to around 2-3% in recent years. The graph on the right shows the fraction of complaints that report a death. This too has declined, suggesting improved vehicle safety or safer driving conditions.
Of course, there are many reasons to complain about a vehicle that do not involve death or injury. I next explore the text of the complaints to to see exactly what kinds of problems people report. The figure below shows the top 30 most common words in the vehicle complaints after pre-processing the data to exclude stop/filler words as well as common words like “vehicle,” “car,” and “issue.”
The word “contact” is the most frequent, which is somewhat interesting since it can mean many different things in the context of cars: communication issues, difficulty reaching out to manufacturers or dealers (”Clutch fails which causes motorcycle to remain disengaged while changing gears. Also, gear comes out of second and into third gear, but cannot go forward. Contacted dealer and they will not fix.”), or even physical contact with another vehicle or a passenger (”Vehicle was involved in a frontal crash, airbag deployed, however did not prevent consumer from hitting steering wheel and sustaining injuries. Consumer feels the airbag didn't fully deploy because it never came in contact with consumer.”).3
Some words in the list are quite surprising. For instance, I didn't expect the word "dealer" to be so frequent, which potentially suggests a lot of complaints involve interactions with dealerships (”Consumer found fuel coming out the front injectors. Consumer had it corrected from previous recall 98V184000/manufacturer's recall 790. It's leaking the exact way as before and dealer is refusing to look at it.”). Alternatively, it could be the case that they filed a complaint to the NHTSA after talking to the dealership, in which case the complaint would include the description of this previous interaction (”Engine check light comes on, steering wheel column locks up, and vehicle stalls unexpectedly. Currently at the dealers.”).
Some words in the graph immediately tell us what the issues are: "engine," "light," "brake," "repair," "warning," and "air" (likely related to airbags). These suggest many complaints are mechanical or operational failures. Notably, "Ford" is the only manufacturer explicitly mentioned, which might suggest a higher frequency of complaints related to this brand or perhaps a larger market share.
A relevant question is whether certain issues have become more salient over time. To address this, I plot the time-series of the number of complaints associated with various words:
Figure 5 shows the number of complaints containing the words "engine," "light," "brake," and "airbags" from 2000 to 2024. Complaints involving “engines” and “lights” have trended up, even as total complaints declined post-2016. Complaints involving brakes peaked in 2011, while those involving “airbags” peaked around 2016. This latter peak is potentially related to the Takata airbag recall, in which vehicles made by 19 different automakers were recalled due to exploding airbags. Give the magnitude of this spike — 5000 complaints in some months of 2016 — it is likely the source of the spike in overall complaints depicted in Figure 1a.
How do people file complaints?
In general, a regulator is primarily interested in identifying systemic risks associated with vehicles based on these complaints. Historical examples of major vehicle recalls, like Toyota’s unintended acceleration issue or the Takata airbag recall, show the importance of catching these problems early to prevent widespread harm.
If we consider that each complaint has both a systemic and an idiosyncratic component, it's crucial for regulators to make filing complaints as easy as possible. By lowering the barriers to filing a complaint, such as reducing the time, effort, and cost involved, regulators can encourage more people to report issues.4
To get a better understanding of the consumers’ complaint filing behavior, I look at the top three most common modes of filing complaints: (i) the NHTSA website, (ii) the Hotline VOQ (Vehicle Owner's Questionnaire), and (iii) Consumer Letters. Not surprisingly complaints increasingly come from online submissions rather than from telephone hotlines or consumer letters.
In an effort to modernize and streamline the complaint process, the NHTSA also rolled out mobile versions of their app. The idea is that making it easier for people to file complaints on-the-go would increase the number of complaints, thereby helping to identify systemic issues more effectively. So did these mobile apps change the complaint behavior? The answer seems to be no: less than 0.3% of complaints are filed through mobile apps.
Which cars and manufacturers?
An important aspect of understanding vehicle complaints is examining the trends across different manufacturers, car brands, and models. This can help identify whether certain manufacturers have consistently higher numbers of complaints, or if there are specific periods when complaints surge, potentially indicating systemic issues or major recalls.
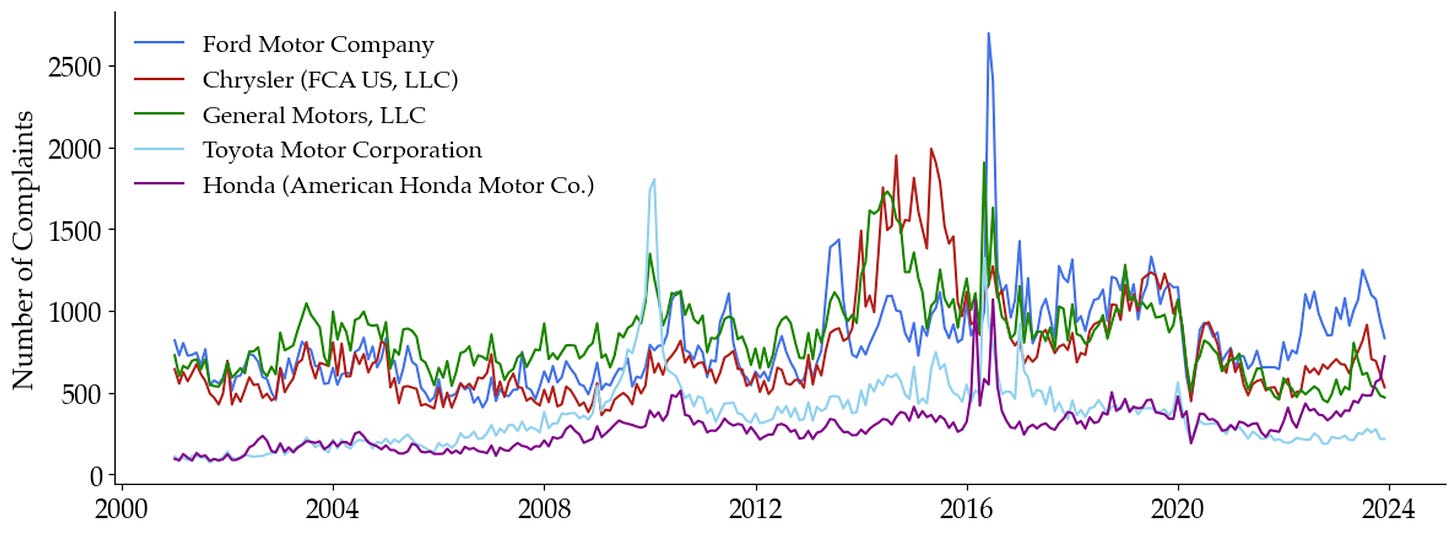
Figure 8 plots the time-series for the five largest manufacturers by number of complaints: Ford, Chrysler, GM, Toyota, and Honda. There is a strong common trend across manufacturers — for example, complaints for all these manufacturers peak in 2016.
There is, however, some interesting heterogeneity among the manufacturers. The left panel of Figure 9 compares the number of complaints pre-COVID and post-COVID for the three U.S. manufacturers: Ford, GM, and Chrysler.
Pre-COVID, the complaints for these manufacturers move somewhat in lockstep. Post-COVID, however, Ford experiences a noticeable increase in complaints compared to GM and Chrysler. This divergence potentially suggests that Ford may have faced unique challenges or quality issues during the pandemic, and it would be interesting to investigate what specific factors contributed to this rise.
In a similar exercise, Panel B of Figure 9 focuses on two Japanese manufacturers, Toyota and Honda. Similar to the trend seen with the U.S. manufacturers, prior to the pandemic the complaints for both manufacturers followed similar patterns, but post-COVID, Honda experiences a noticeable rise in complaints compared to Toyota.
Conclusion
Let’s end the post with a few takeaways and some open questions.
Takeaways
The number of vehicle complaints has shown a clear upward trend, peaking around 2016. Despite a decline since then, the number of complaints remains significant, with a notable dip around 2020. The drop in complaints during the COVID-19 pandemic can be explained by the drop in motor vehicle sales and a decrease in fatal crashes, and the peak in 2016 seems to be driven by the increase in complaints related to the Takata airbag.
Complaints containing the words "engine" and "light" have been steadily increasing over the years. On the other hand, complaints containing the word "brake" show a significant spike around 2011-2012, with varying but generally lower levels in the subsequent years.
The mode of filing complaints has shifted significantly over time. While the NHTSA website has become the predominant method for filing complaints, other modes such as the Hotline VOQ and consumer letters have seen a decline. Despite the introduction of mobile apps, their adoption remains very low, suggesting a preference for traditional and web-based complaint methods.
Complaints vary widely among manufacturers and types of cars. Pre-COVID, complaints for Ford, GM, and Chrysler move together, but post-COVID, Ford saw a noticeable increase compared to GM and Chrysler, suggesting unique challenges or quality issues during the pandemic. Comparing across Japanese manufacturers, there are similar levels of complaints for Toyota and Honda pre-COVID, while Honda experiences more complaints post-COVID.
Some Open Questions
Common perceptions about the reliability and safety of certain brands, such as Japanese cars or Volvo, which often top consumer reports, may need to be re-evaluated. This raises the question: does the actual complaints data support these perceptions? Of course, if consumer reports are based on the complaints data, this could illustrate reverse causality.
Are there geographic differences in the number and types of complaints? Understanding regional variations could provide insights into different driving conditions, regulatory environments, or consumer behavior and ultimately what drives this the time-series variation.
How do vehicle complaints compare to complaints for other consumer products? This would be useful to contextualize the severity and frequency of vehicle issues relative to other goods and services.
Do complaints correlate with various financial metrics of the company, such as stock price or revenue? Are these complaints leading or lagging indicators of firm-level financial and real performance?
The dataset covers 1,282 unique manufacturers (e.g. Chrysler), 1,492 unique makes (e.g. Jeep), and 7,691 unique models (e.g. Grand Cherokee). But there are a lot of close duplicates in the data, such as “ACCORD”, “ACCORD HYBRID,” “ACCORD PLUG-IN HYBRID.” I suspect this is because the filer of the complaint enters this manually.
This is a popular database among economists that provide an easy API and raw time-series data for a very wide range of variables.
This is where using an LLM to obtain context-dependent embeddings would be quite useful.
A systemic component refers to issues that affect many vehicles of a particular make or model, indicating a widespread problem. For example, the Takata airbag recall affected millions of vehicles across various manufacturers. An idiosyncratic component refers to issues specific to an individual vehicle, such as a one-off manufacturing defect or a maintenance issue unique to that car. Additionally, a person might file a complaint out of grumpiness, exaggeration, or dishonesty about the magnitude of the problem. If this behavior is not common across people, then collecting more complaints can help wash out these individual discrepancies.


good job!